Study Shows Large Variability in Abundance of Viruses that Infect Ocean Microorganisms
Jan 24, 2016 — Atlanta, GA

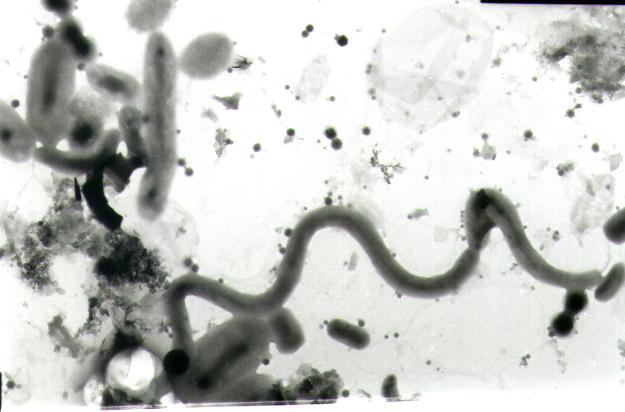
Community of bacteria (larger cells) and viruses (small background dots of varying sizes) from a seawater sample off the southwest coast of Norway. The transmission electron micrograph illustrates an approximate virus to microbial cell (VMR) ratio of 10. (Credit: Willie Wilson, Sir Alister Hardy Foundation for Ocean Science)
Viruses infect more than humans or plants. For microorganisms in the oceans – including those that capture half of the carbon taken out of the atmosphere every day – viruses are a major threat. But a paper published January 25 in the journal Nature Microbiology shows that there’s much less certainty about the size of these viral populations than scientists had long believed.
Collecting and re-examining more than 5,600 estimates of ocean microbial cell and virus populations recorded over the past 25 years, researchers have found that viral populations vary dramatically from location to location, and at differing depths in the sea. The study highlights another source of uncertainty governing climate models and other biogeochemical measures.
“What was surprising was that there was not a constant relationship, as people had assumed, between the number of microbial cells and the number of viruses,” said Joshua Weitz, an associate professor in the School of Biology at the Georgia Institute of Technology and one of the paper’s two senior co-authors. “Because viruses are parasites, it was assumed that their number would vary linearly with the number of microbes. We found that the ratio does not remain constant, but decreases systematically as the number of microbes increases.”
The research, which involved authors from 14 different institutions, was initiated as part of a working group from the National Institute for Mathematical and Biological Synthesis (NIMBioS), which is supported by the National Science Foundation. The research was completed with additional support from the Burroughs Wellcome Fund and the Simons Foundation. The research was co-led by Steven Wilhelm, a professor of microbiology at the University of Tennessee, Knoxville.
In the datasets examined by the researchers, the ratio of viruses to microbes varied from approximately 1 to 1 and 150 to 1 in surface waters, and from 5 to 1 and 75 to 1 in the deeper ocean. For years, scientists had utilized a baseline ratio of 10 to 1 – ten times more viruses than microbes – which may not adequately represent conditions in many marine ecosystems.
“A marine environment with 100-fold more viruses than microbes may have very different rates of microbial recycling than an environment with far fewer viruses,” said Weitz. “Our study begins to challenge the notion of a uniform ecosystem role for viruses.”
A key target for viruses are cyanobacteria – marine microorganisms that obtain their energy through photosynthesis in a process that takes carbon out of the atmosphere. What happens to the carbon these tiny organisms remove may be determined by whether they are eaten by larger grazing creatures – or die from viral infections.
When these cyanobacteria die from infections, their carbon is likely to remain in the top of the water column, where it can nourish other microorganisms. If they are eaten by larger creatures, their carbon is likely to sink into the deeper ocean as the grazers die or excrete the carbon in in their feces.
“Viruses have a role in shunting some of the carbon away from the deep ocean and keeping it in the surface ocean,” said Wilhelm. “Quantifying the strength of the viral shunt remains a vital issue.”
Influenza and measles come to mind when most people think of viruses, but the bulk of world’s viruses actually infect microorganisms. Estimates suggest that a single liter of seawater typically contain more than ten billion viruses.
To better understand this population, the researchers conducted a meta-analysis of the microbial and virus abundance data that had been collected over multiple decades, including datasets collected by many of the co-authors whose laboratories are based in the United States, Canada and Europe. The data had been obtained using a variety of techniques, including epifluorescence microscopy and flow cytometry.
By combining data collected by 11 different research groups, the researchers created a big picture from many smaller ones. The statistical relationships between viruses and microbial cells, analyzed by first-author Charles Wigington from Georgia Tech and second-author Derek Sonderegger from Northern Arizona University, show the range of variation.
The available data provides information about the abundance of viral particles, not their diversity. Viruses are selective in the microbes they target, meaning the true rates of infection require a renewed focus on virus-microbe infection networks.
“Future research should focus on examining the relationship between ocean microorganisms and viruses at the scale of relevant interactions,” said Weitz, “More ocean surveys are needed to fill in the many blanks for this critical part of the carbon cycle. Indeed, virus infections of microbes could change the flux of carbon and nutrients on a global scale.”
This work was supported by National Science Foundation (NSF) grants OCE-1233760 and OCE-1061352, a Career Award at the Scientific Interface from the Burroughs Wellcome Fund and a Simons Foundation SCOPE grant. This work arose from discussions in the Ocean Viral Dynamics working group at the National Institute for Mathematical and Biological Synthesis, an Institute sponsored by the National Science Foundation through NSF Award DBI-1300426, with additional support from The University of Tennessee, Knoxville. The content is solely the responsibility of the authors and does not necessarily represent the official views of the National Science Foundation.
CITATION: Charles H. Wigington, et al., “Re-examination of the relationship between marine virus and microbial cell abundances,” (Nature Microbiology, 2016). http://dx.doi.org/10.1038/nmicrobiol.2015.24
Research News
Georgia Institute of Technology
177 North Avenue
Atlanta, Georgia 30332-0181 USA
Media Relations Assistance: John Toon (404-894-6986) (jtoon@gatech.edu).
Writer: John Toon

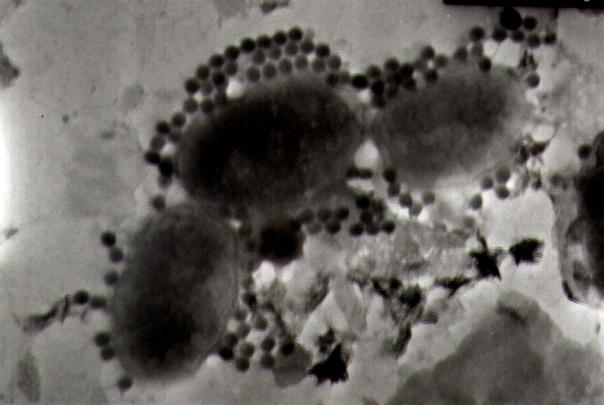
Sometimes the virus to microbial cell (VMR) ratio can be skewed naturally during a (for example) burst of viruses from a bacterial cell. This transmission electron micrograph from a seawater sample off the southwest coast of Norway illustrates a high VMR as a result. (Credit: Willie Wilson, Sir Alister Hardy Foundation for Ocean Science)

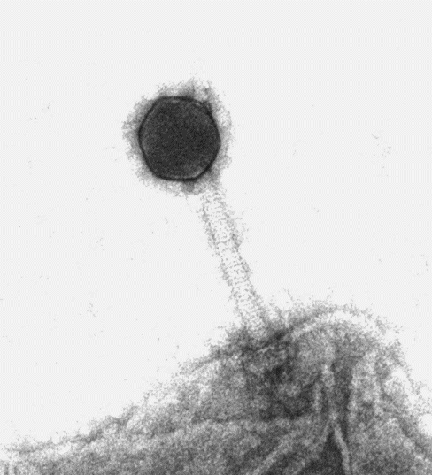
Cyanophage isolate S-PM2 is an example of a commonly occurring virus that infects marine cyanobacteria, photosynthetic microbial cells that have a ubiquitous distribution in the oceanic photic zone. This particular virus was isolated in the English Channel off Plymouth, England. (Credit: Willie Wilson, Sir Alister Hardy Foundation for Ocean Science)

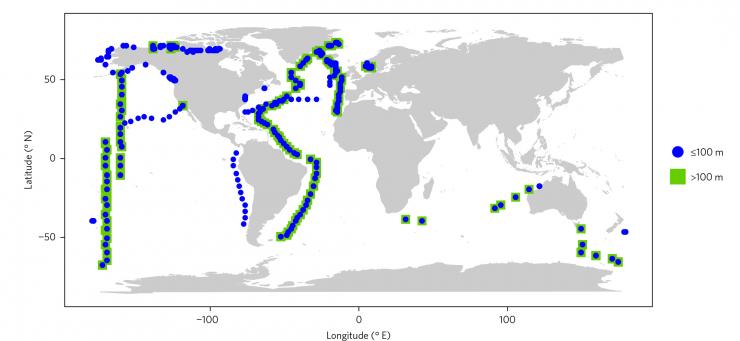
Map shows the global distribution of sample sites where measurements of virual populations were obtained. Each point denotes a location from which one or more samples were taken.


