What Going Viral Looked Like 120 Years Ago
Mar 06, 2016 — Atlanta, GA

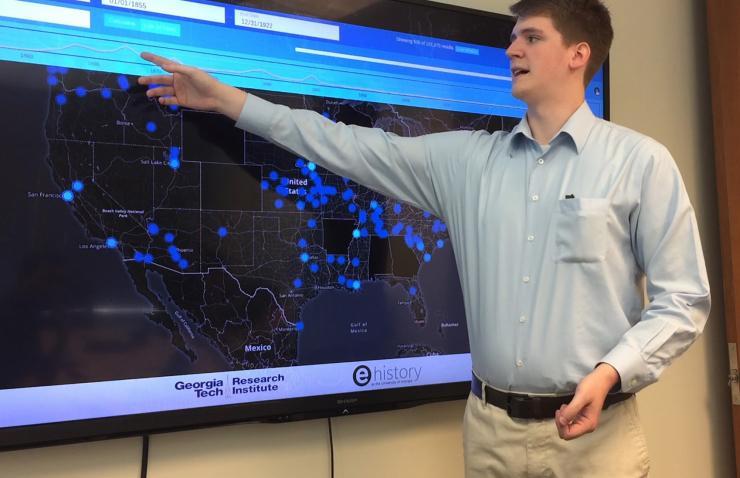
Georgia Tech Research Institute (GTRI) Research Scientist Trevor Goodyear shows features of U.S. News Map, a database of more than 10 million newspaper pages that is helping researchers see history with spatial information that hadn’t been available before. (Credit: Georgia Tech).
Populist presidential candidate William Jennings Bryan electrified the 1896 Democratic National Convention with a speech in which he called for a new currency standard based on silver rather than gold. Over the next few years, his “Cross of Gold” ideas spread across the country, with thousands upon thousands of newspaper mentions.
But it took 120 years and a collaboration between Georgia Tech data scientists and University of Georgia historians to see what the spread of that idea had actually looked like. Starting in Chicago, site of the convention, “Cross of Gold” moved to the populous East Coast, then jumped to the West Coast before filling in the less populated areas.
“Going viral” may have taken longer in the 19th century, but the principle was much the same.
Researchers tracked Cross of Gold’s spread using U.S. News Map, a database of more than 10 million newspaper pages that is helping researchers see history with spatial information that hadn’t been available before. Using digitized newspaper articles and cutting-edge search technology, the project is helping researchers see the nation’s history in new ways.
“Every historical development has a spatial component to it, and often one that is central to explaining the ‘how’ and the ‘why,’” noted Claudio Saunt, chair of the Department of History at the University of Georgia. “With this new search engine, we now have the ability to see where newspapers were writing about a subject, and how interest in that subject changed over time. It’s a powerful tool for historians, and one that can shed new light on the past.”
A free service, the database is available at USNewsMap.com. It is based on data from approximately 10 million pages published in nearly 2,000 U.S. newspapers between 1836 and 1924. The newspapers represent what was happening in nearly 800 U.S. cities. More pages are being added all the time, though some states still have not contributed digital newspaper data and are therefore not represented on the project’s map.
To create the database behind the search engine, text from the newspaper pages was scanned by universities around the country, and each word indexed, explained Trevor Goodyear, a research scientist in the Georgia Tech Research Institute (GTRI). The application uses Apache Solr database software, a document database that allowed GTRI researchers to efficiently store and index the large volumes of text and associated metadata.
The processed text exists across eight different servers, some in a data center at Georgia Tech and some in a cloud server provided by Amazon Web Services. When a user types an inquiry into the website, the servers all participate in the search together. The text database is linked to images of the newspaper pages housed at the Library of Congress, so when users find an item of interest, they can see its context on the original newspaper page.
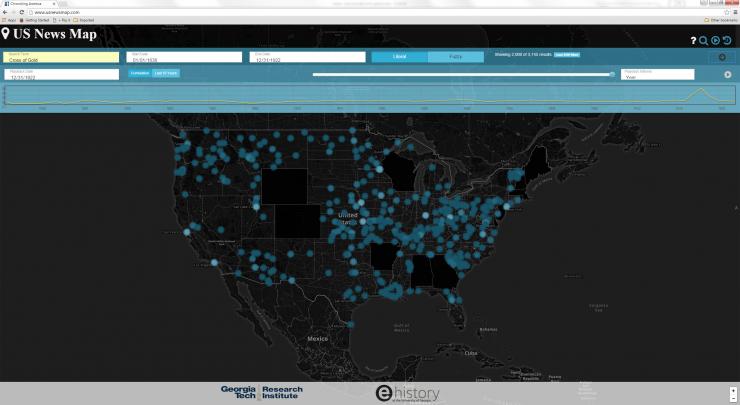
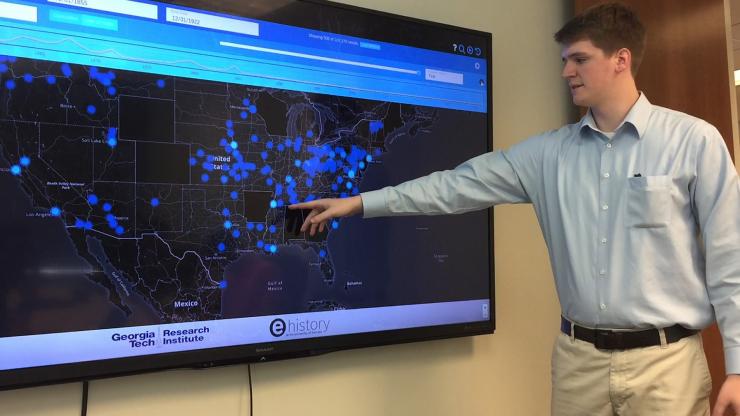
The innovations, said Goodyear, were to show when each instance of a term appeared in the newspapers and to animate those appearances. Dots on the map show all mentions of the term in all newspapers across each U.S. city, lighter dots indicating multiple mentions. Users of the site can move a slider to see how terms pop up in different cities over time.
“We’ve placed the data onto a map of the United States that allows users to view how the term moved across the country over time,” he said. “You can navigate through time to see how each term was used in different locations. You really get a sense for how ideas went viral during that time in history.”
The Library of Congress awards grants to universities across the United States for digitizing historic newspapers. This digitization process involves applying optical character recognition (OCR) techniques to convert the printed words into computerized text. Through imperfections in the newspapers’ preservation and errors in the scanning and translation process, the results can look very different from what was originally published in the newspapers. Information lost in translation includes the distinctions between headlines, article content, author bylines, and newspaper titles. Due to these limitations, the system links users to the full newspaper page on which the search term appears instead of to individual scanned articles.
Other newspaper databases exist and the Library of Congress newspaper collection is searchable, but no other source shows the spatial component of history in this way, said Saunt, who is the Richard B. Russell Professor in American History. He expects U.S. News Map will be useful to more than historians.
“With U.S. News Map, it is easy to trace the evolution of a term – to see where it originated and how it spread – something that linguists are deeply interested in,” he said. “Historians will be able to see how news stories moved across the continent, and rose and fell over time.”
At the University of Georgia, the project began with Saunt and collaborators Stephen Mihm and Steve Berry in the institution’s eHistory.org program, which is affiliated with the Willson Center Digital Humanities Lab. “We brainstormed the idea of building a website to allow the public to visualize searches in the massive Library of Congress digital newspaper database, ‘Chronicling America,’ by showing the results on a map,” Saunt explained.
The UGA researchers contacted a colleague at Georgia Tech, where data science and data analytics are part of research in GTRI’s Innovative Computing Division. The project demonstrates how data science can extract new knowledge from massive data sets, Goodyear said.
“We had never worked with large text-based data sets like this before, and it offered an interesting challenge to conventional techniques,” he added. “We had to adjust techniques developed for short text to longer newspaper text.”
Other search examples:
- The term “miscegenation” appeared in 1864, coined during the presidential election that year. “You can type it into the search box and watch it spread across the continent like a plague,” said Saunt.
- The term “Ghost Dance,” describing the ceremonial dance that Native Americans began performing in the 1870s, appeared sporadically in western newspapers. But after the massacre at Wounded Knee, it was picked up by the press nationally, noted Saunt, who is associate director of the Institute of Native American Studies.
- Georgia Tech appeared in newspapers in 1888 when fire destroyed the Institute’s Old Shop Building. Newspapers reported the fire and the amount of insurance coverage available, Goodyear noted. Georgia Tech began appearing regularly in newspapers once the publication of sports scores became common.
- The database covers much of the Industrial Revolution in the United States. A search turned up more than 207,000 mentions of inventor Thomas Edison, and 64,000 mentions of influential technology company General Electric.
Research News
Georgia Institute of Technology
177 North Avenue
Atlanta, Georgia 30332-0181 USA
Media Relations Contacts: Georgia Tech – John Toon (jtoon@gatech.edu) (404-894-6986); University of Georgia – Dave Marr (davemarr@uga.edu) (706-542-2640) or Alan Flurry (aflurry@uga.edu) (706-542-3331).
Writer: John Toon

Image shows how mentions of a term appear over time in U.S. News Map, a database of more than 10 million newspaper pages that is helping researchers see history with spatial information that hadn’t been available before. (Credit: Georgia Tech)

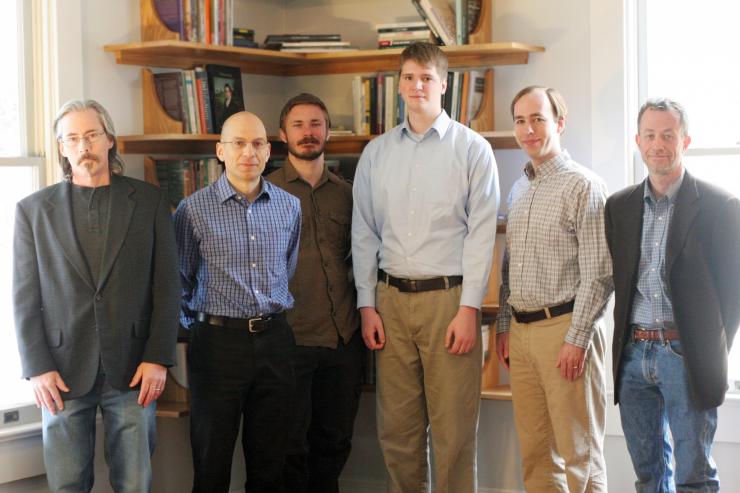
Researchers from the University of Georgia and the Georgia Institute of Technology worked together to create U.S. News Map, a database of more than 10 million newspaper pages that is helping researchers see history with spatial information that hadn’t been available before. (Credit: University of Georgia)

Georgia Tech Research Institute (GTRI) Research Scientist Trevor Goodyear shows features of U.S. News Map, a database of more than 10 million newspaper pages that is helping researchers see history with spatial information that hadn’t been available before. (Credit: Georgia Tech).


